Assertions in Jmeter examples

Assertions in Jmeter is very useful components ,Assertions in Jmeter are performs an extra task to verify results of Samplers whether it may be HTTP Requests,SOAP request or REST API services.Assertions are verifies once the main sampler is completes the requests.Mainly assertions are applied for main samplers and not applied on sub-samplers.

Assertions in Jmeter examples
Assertion in Jmeter

Assertions in Jmeter examples

Apache JMeter providing different assertions lists to verify different samaplers as stated above,Following are the assertions are available in JMeter.

Response Assertion
Duration Assertion
Size Assertion
XML Assertion
BeanShell Assertion
MD5Hex Assertion
HTML Assertion
XPath Assertion
XML Schema Assertion
BSF Assertion
JSR223 Assertion
Compare Assertion - The Compare Assertion can be used to compare sample results within its scope
SMIME Assertion

Assertions can be applied to Main samples or Sub samples and default is main samples or you can apply for both together i.e main sample and sub-samples options in assertion window.Let's see one by one assertions explanation in details.

How to Add Assertions

Please follow below steps to add different assertions to your Test plan or Thread Group.

1.Open Apache Jmeter from apache jmeter 3.0/bin/ folder
2.Double click on jmeter.bat file
3.JMeter window opens
4.Now right click on Test plan - add-Threads - Thread Group
5.Right Click on Thread Group - Add - Assertions- here all available assertions will displays.

Response Assertions

Response Assertions allows you to verify the response of the samples with the help of different patterns as displaying below screenshot.
Response Assertion
Response Assertion Control Panel

Patterns are

  1. Contains
  2. Matches
  3. Equals
  4. Substring
  5. Not

In Pattern to test textbox you can simply enter text as Success or to verify the title of the page as Jmeter Tutorials or Assertions in Jmeter etc and you can select response Field to test as Text Response , Document(Text) , URL Sampled , Response Code (200 - ok ,404 - HTTP Error etc) , Response Message ,Response Headers and Ignore Status.As per above pattern you can verify the Response of samplers with Response Assertions.

Example:

In application I want to verify the title then we will select options as below.

Apply to  : Main Sample Only
Response Field to Test : Text Response
Patterns Matching Rules : Contains - It will search entire web page and verify the response
Pattern to Test  - Assertions in Jmeter examples

Note:You can add multiple assertions to any samples to verify the response.

Duration Assertion

As per Duration Assertion it will verify each response time whether sample response will receives within specified duration in milliseconds,in case response is not received for that particular request in specified assertion time then that request will get Failed.
Duration Assertion
Duration Assertion Control Panel


Duration Assertion will have below options

1.Apply to : Main Sample and Sub-Samples , Main Sample Only and Sub-Sample Only
2.Duration to Assert : Duration in Milliseconds - The maximum number of milliseconds for each response should receive.

Size Assertion

Size assertion in JMeter verifies what are the bytes it should have while complete that particular request.Size assertion control panel provides below types .
Size Assertion
Size Assertion Window


Equals to
Not Equal to
Greater than,
Less than,
Less than equal to
Greater than equal to for a given number of bytes.

In case bytes size is matches than it will Pass other wise assertion will fails.

XML Assertion

The XML Assertion verify that the gives response data officially contains a correct XML document or not. It does not corroborate the XML based on a DTD or schema to do any additional validation process.

XML Assertion
XML Assertion window


BeanShell Assertion

The Beanshell Assertion in jmeter is useful in validate the response of request with the help of BeanShell script,to learn Beanshell scripting please read Beanshell Tutorials.
BeanShell Assertion
Bean Shell Assertion Panel


Beanshell assertion window displays following details

Name - Name of the BeanShell Assertion
Comments - you can provide any comments regarding this assertion
Reset bsh.interpreter before each call - In case this option is selected, than the interpreter will be recreated for each samples and it is useful only when your scripts runs for longer time.
Parameters - Specified parameters to pass into your Beanshell script
Script File - In case you have script file ,you can run your assertion with the file with proper script in the file and path of the script file.
Script - This area provides to option to create a script to validate the response of samples.

HTML Assertion

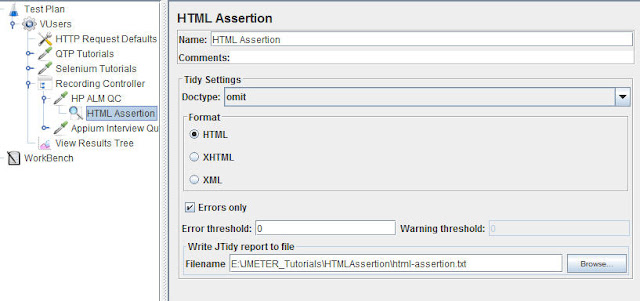
The HTML Assertion validates the HTML syntax of the response data using JTidy option as below mention screenshot.The HTML assertion has below options to verify the response.
HTML Assertion
HTML Assertion window


Tiday Settings

Tidy settings has below option

Doctype : Doctype has omit,auto,strict and loose list items.
Format : It has HTML,XHTML and XML options
Error Only : Verifies only errors in HTML format as selected formats
Error threshold : No of errors allowed before alloting the particular request response as failed
Warning threshold : Number of warnings allowed before alloting the particular request response as failed
Filename : Name of the file to which report is to be write with results as below details written in txt file

Error HTML Assertion Results:

line 2 column 1 - Warning: unknown attribute "xmlns:expr"
line 2 column 1 - Warning: unknown attribute "xmlns:data"
line 2 column 1 - Warning: unknown attribute "xmlns:b"
line 16 column 1 - Warning: unknown attribute "property"
line 17 column 1 - Warning: unknown attribute "property"
line 18 column 1 - Warning: unknown attribute "property"
line 24 column 128 - Warning: Warning: unescaped & or unknown entity "&zx"
InputStream: Doctype given is ""
InputStream: Document content looks like XHTML 1.0 Transitional
212 warnings, 25 errors were found!
This document has errors that must be fixed before
using HTML Tidy to generate a tidied up version.
The table summary attribute should be used to describe
the table structure. It is very helpful for people using
non-visual browsers. The scope and headers attributes for
table cells are useful for specifying which headers apply
to each table cell, enabling non-visual browsers to provide
a meaningful context for each cell.
For further advice on how to make your pages accessible
see "http://www.w3.org/WAI/GL". You may also want to try
"http://www.cast.org/bobby/" which is a free Web-based
service for checking URLs for accessibility.


XPath Assertion


The XPath assertion in JMeter to verify the response of samples with the help of XPath,please read this post for clear understanding with real time examples,How to write XPath assertion to verify particular request response in Jmeter.


XML Schema Assertion


The XML schema assertion is able to validate XML scheme in particular request response to verify assertion is pass or fail.

XML Schema Assertion

Apache Jmeter Web Test Plan

Apache Jmeter providing option to prepare web test plan to perform performance testing of your website in QA or production environment.Let us build simple web test plan ,here I am using my blog where pages are end with HTML extension.It is very easy to build web test plan in JMeter.

Apache Jmeter Web Test Plan

Please follow below easy steps to create JMeter Web Test Plan to perform load testing for different HTTP Requests of your applications.

Step 1 : Open Jmeter


Open Jmeter from F:\Java_Applications\apache-jmeter-3.0\bin folder by double click on jmeter.bat file in windows operating system,the JMeter windows open as below.

Apache Jmeter Web Test Plan


Step 2 : Test Plan 


Change the Test plan name as Software Testing ,i choosen this name because i am preparing Test plan for Software Testing blog,so you can mention any simple name for your Test Plan as mention below.

Test Plan Options


No need of Changing below Option.

1.Run Thread Groups Consecutively(i.erun groups one at a time).
2.Run teardown Thread Groups after shutdown of main threads.
3.Functional Test Mode.

Step 3 : Add Thread Group


Add Thread Group by Right Click on Test Plan - Add - Threads(Users) - Thread Group,Thread Group is the main component to access Samples , Controllers , Assertions and Listeners components
in our Test plan to verify the performance of Samples.

Apache Jmeter Web Test Plan
Threaad Group

Thread Group has below options

Thread Properties:


1.Number of Threads(Users)
2.Ramp-Up Period(in Seconds)
3.Loop Count []Forever.

Rename the Thread Group as VUsers,Just follow same as below window configurations.

Step 4 : HTTP Sampler


Now it's time to add HTTP Samplers in our Test Plan under Thread Group to add web application ,just right click on Thread Group - Add - Sampler - HTTP Request.It will add HTTP Request
under Thread Group and below window appears as below.
Apache Jmeter Web Test Plan
HTTP Request


HTTP Request has below configurations

Name - Change the name of the Request as Selenium Tutorials because we are adding Selenium Tutorials html page from blog.
Server Name or IP - ServerName indicates on which server it is deployed here server name is my blog softwaretestutorials.blogspot.in,in case in your company any ip address is providing then please add ip address here
Port - here not required,in case any port number is required in your company applications please enter port number.
Protocol - Here protocol is not required presently,will keep this as blank AS IS.
Path - Here path will mention with  ' / ' to seperate the html pages as Example : /p/selenium-tutorials.html then while running it will run as softwaretestutorials.blogspot.in/p/selenium-tutorials.html

Step 5 : Listeners


Listeners able to check your test plan HTTP request response whether request is giving proper response as a realtime environment.Here i am adding View Result Tree to view HTTP Request response ,in this listener you can view the response as Text,HTML,JSON etc formats.

Add Listeners:


  • Right click on Thread Group.
  • Click on Add - Listners.
  • Select View Result Tree in list items.Please see below View Result Tree window.
Apache Jmeter Web Test Plan
Jmeter Listners


Step 6 : Execute Test Plan


We have added all required Samplers,configured required sampler details as Server Name,Path etc and added Listeners to view the HTTP Sampler results.We can use Assertions to verify whether response is valid or not inorder to check PASS or FAIL.

Apache Jmeter Web Test Plan
Failed Requests


  • Now run the Test Plan by clicking on Green color icon or
  • Select Run menu and Click on Start option(Ctrl + R)
  • I have added two HTTP requests.

Please save your Test plan because it will ask you to save test plan and Save the Test plan as SoftwareTesting.jmx format and in Jmeter all test plans saves in JMX formats and you will observe your test plan will start running with one thread user ,1 second ramp up period and loop count is 1 ,here you can change number of thread users.Once the test plan running completed all your HTTP requests results will display in ViewResults Tree listeners.

View Results Tree


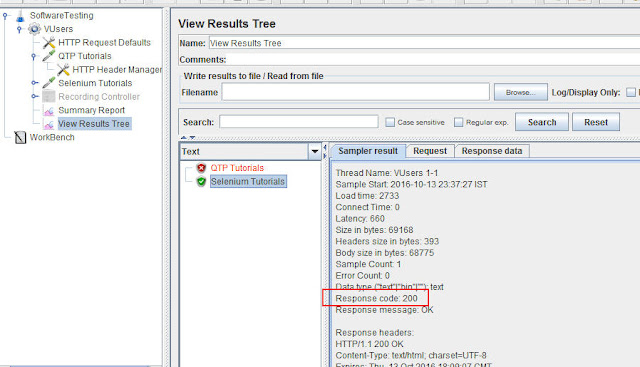
Your all samples results will display in Listeners as below and below points observed

Green Color - indicates particular HTTP Sampler request is Passed.
Red Color - Indicates particular HTTP Sampler request is Failed,it could be different reasons.

Apache Jmeter Web Test Plan


Here i have used only simple Test plan and you can run test plan with many number of Thread Users such as 10,20 or 25 etc users,Different Ramp-Up period by this you can check proper average response time for different HTTP requests.You can check Summary Report Listener to check Min,Max,Average in milliseconds,Throughput,Error percentage etc details as below.

Summary Report


Apache Jmeter Web Test Plan
Summary Report

xpath assertion in jmeter example

Apahe JMeter assertions is very useful and amazing components in JMeter to validate whether request is pass or fail ,in my previous post you learned about Transaction Controller in JMeter to create nested HTTP Samples.In this post you will learn how to use XPath assertion in JMeter with real example to verify the response of HTTP request as per designed Test plans.Please visit w3c tutorials for XPath tutorials.

What is XPath Assertion?

Xpath Assertion in Jmeter tests a response of particular request which will validate the xpath as defines,in case xpath exists in response then that Asseertion is true,if that xpath does not exist's then Assertion is false means fails.

xpath assertion in jmeter example

XPath Assertion examples:

//title[text()='Selenium']- Which will matches the Selenium text anywhere in the response for that request.
/return/message='Success' - Which will matches the Success message in a root level response.

XPath Assertion in Jmeter example

XXPathassertion is useful in validating the response in case unable to find the root element directly in the response or document.Please follow below steps to create Xpath Assertions in your test plan for requests.
1.Open Jmeter from bin folder.
2.Add ThreadGroup.
3.Add Samples may be it could be HTTP Samples/SOAP Request Samples.

xpath assertion in jmeter example

4.Now add Xpath Assertion from Assertions menu to validate the response.
For SOAP response you can write xpath assertion as below to validate particular tag text as <message>Success</message>


Response is


<soap Envelope xmlns:soap="http://schemes:xmlsoap.org/soap/etc"/>
<soap:body>
<ns2:customerdetails xmlns:ns2="http://xmlns:...">
<return>
<code>1</code>
<message>Success</message>
<customerdetails>
<custName>Rajesh kuchana</custName>
<dob>10-01-1986</dob>
<title>Mr</title>
</customerdetails>
</return>
</ns2:customerdetails>
</soap:Body>
</soap:Envelope>

You can write Xpath Assertion to validate the response of request is as below.

First Example:

//retunr/message='Success'

Second Example:

//return/code='1'
/return/customerdetails/title='Mr'

Third Example:

//return[text()='Success']
//return/customerdetails/custName[text()='Rajesh Kuchana']

For Web Applications:

You can prepare Xpath Assertions to validate the web applications also ,please check below examples to clear understansing.

<html>
<head>
<title>Learn Jmeter Tutorials</title>
</head>
<body></body>
</html>

You can write xpath assertion as below to verify title text.
//head/title/text()='Selenium Tutorials'


xpath assertion in jmeter example


Please check Use Tidy(tolerant parser) check box on,it will automatically hide the error while running your script to identify the response and validate it with xpath assertion as below.


xpath assertion in jmeter example


Now check your Summary Report and View Results Tree.

View Result Tree

xpath assertion in jmeter example

Summary Report


What have you learned?

1.XPath Assertion in Jmeter
2.How to write XPath Assertion for Soap Response and Web applications.
3.How to check results using Assertion Results in Listeners.
4.How to prepare XPath assertion to Particular Response.

Transaction controller in jmeter

Transaction Controller in Jmeter which is useful in measures child samples time taken to complete the transactions.Performance Testing with JMeter for Web applications i.e Samples which is HTTP sample requests and which have resources as Images,Stylesheets,Css,recording etc.

Transaction controller in jmeter

What is Transaction Controller?

Transaction Controller is generates an extra samples same as HTTP Samples in order to measures the overall time taken or response time of Transaction controller of child test samples,don't worry we will learn in details with real-time examples.

Transaction Controller in Jmeter

Transaction Controller has two check boxes,those are

1.Generate Parent Samples
2.Include duration of timer and pre-post processors in generated sample - It is the time which includes all processing samples within the Transaction controller , not just the HTTP samples.

Generate Parent Samples

If you check Generate Parent Samples check box in Transaction Controller then in Summary Report it will display only Transaction Controller Label and remaining nested HTTP Samples will not display in Summary Report.Please see below screenshot.Overall Response time is taken will display in Transaction Controller with nested HTTP Samples.It is not good practice to perform or run your test plan to perform performance testing of a proper test scenario.

Transaction controller in jmeter

Test Scenario

Open Product Page - Search The product - Checkout the Product page - Perform Payment

The above scenario will look like as below

Transaction Controller
Open Product Page Samples 1
Search The product sample 2
CCheck out the product sample 3
Payment sample 4

Above four samples are nested elements for Transacstion Controller,if you run above scenario or test plan with Generate Parent Samples check box on it will display only Transaction Controller label name and will not display all four samples label name in summary report.

Transaction controller in jmeter
Summary Report


If you want to check all the samples label name in Summary Report don't check Generate Parent Samples check box in Transaction Controller.

Transaction Controller without Generate Parent Samples

Uncheck Generate Parent Samples in Transaction Controller screen.

Transaction controller in jmeter


Now run your Test plan it will display Nested HTTP Samples + Transaction Controller Sample in Summary Report(Which will display all nested samples details as below).

Transaction controller in jmeter
Summary Report-Transaction Controller

Transaction Controller Problems

1.In Case one sample is failed then entire Transaction Controller will fail
2.In case any one sample assertion is failed then entire Transaction Controller will fail.

How to Generate Jmeter Report Dashboard

Apache JMeter is an open source performance tool which is helpful in testing load test for WebApplications and WebServices,REST API services.In latest JMeter 3.0 version apache software included Generate Jmeter Report Dashboard using APDEX(Application Performance Index).
How to Generate Jmeter Report Dashboard
How to Generate JMeter Report Dashboard

What is APDEX?

APDEX is an open standard which is developed by an alliance companies.APDEX which is useful in measure user satisfaction with the help of response time of applications and Services(WebServices/REST API).APDEX measures average time with the help of response time of application under test whether it could be web applications or WebServices.APDEX measure application response time with three levels,those are

1.Satisfied.
2.Toleration Threshold.
3.Frustration Threshold.

How to Generate JMeter Report Dashboard

Please follow below steps to Generate JMeter report dashboards for a test plan.

  1. Download Apache JMeter 3.0 from Apache Software Foundation website.
  2. Unzip the file.
  3. Open Jmeter GUI using jmeter.bat file from Apache Jmeter3.0/bin folder.
  4. Create Test plan for Web Applications or Web-Services.
  5. Add Summary Report,Simple Data Writer from Listeners.

How to Generate Jmeter Report Dashboard


Set Thread Group as

  • Number of Thread(Users) - 5
  • Ramp Up Period - 2
  • Loop Count Foreve
  • Duration in Scheduler - 300
  • StartUp Delay - 0

How to Generate Jmeter Report Dashboard


Please Read below posts to understand current post easily.

Record Script in Jmeter
Run test plan untill specified Time.

Note:

Please don't create any CSV file file before running your Test Plan ,with the help of Simple Data Writer Test Result file automatically created in specified location.

How to Generate Jmeter Report Dashboard

Simple Data Writer Configuration:

Before Running your test plan we should configure below fields in Simple Data Writer window panel,those are
  1. timeStamp
  2. elapsed
  3. label
  4. responseCode
  5. responseMessage
  6. threadName
  7. dataType
  8. success
  9. failureMessage
  10. bytes
  11. grpThreads
  12. allThreads
  13. Latency
  14. IdleTime
Just click on Configure button in Simple Data Writer window panel then it will open Simple Result Save Configuration window then you have to select above checkboxes ,please see below screenshot.

Generate report dashboard in jmeter

Once everything is done just click on Done button and save your Test Plan script.


View Below Video for Better Understand


Jmeter Report Generation Configuration

In Apache jmeter 3.0 version it has given reportgeneration properties file ,if you open that file it will display all report generation configuration details,simply copy those jmeter.reportgenerator configuration in User Properties file as below.

Copy SAVE Service configurations also in User Properties file.

How to Generate Jmeter Report Dashboard


#---------------------------------------------------------------------------
# Reporting configuration
#---------------------------------------------------------------------------

# Sets the satisfaction threshold for the APDEX calculation (in milliseconds).
jmeter.reportgenerator.apdex_satisfied_threshold=500

# Sets the tolerance threshold for the APDEX calculation (in milliseconds).
jmeter.reportgenerator.apdex_tolerated_threshold=1500

# Sets the size of the sliding window used by percentile evaluation.
# Caution : higher value provides a better accuracy but needs more memory.
#jmeter.reportgenerator.statistic_window = 200000

# Configure this property to change the report title
jmeter.reportgenerator.report_title=Apache JMeter Dashboard

# Defines the overall granularity for over time graphs
jmeter.reportgenerator.overall_granularity=60000

# Response Time Percentiles graph definition
jmeter.reportgenerator.graph.responseTimePercentiles.classname=org.apache.jmeter.report.processor.graph.impl.ResponseTimePercentilesGraphConsumer
jmeter.reportgenerator.graph.responseTimePercentiles.title=Response Time Percentiles

# Response Time Distribution graph definition
jmeter.reportgenerator.graph.responseTimeDistribution.classname=org.apache.jmeter.report.processor.graph.impl.ResponseTimeDistributionGraphConsumer
jmeter.reportgenerator.graph.responseTimeDistribution.title=Response Time Distribution
jmeter.reportgenerator.graph.responseTimeDistribution.property.set_granularity=500

# Active Threads Over Time graph definition
jmeter.reportgenerator.graph.activeThreadsOverTime.classname=org.apache.jmeter.report.processor.graph.impl.ActiveThreadsGraphConsumer
jmeter.reportgenerator.graph.activeThreadsOverTime.title=Active Threads Over Time
jmeter.reportgenerator.graph.activeThreadsOverTime.property.set_granularity=${jmeter.reportgenerator.overall_granularity}

# Time VS Threads graph definition
jmeter.reportgenerator.graph.timeVsThreads.classname=org.apache.jmeter.report.processor.graph.impl.TimeVSThreadGraphConsumer
jmeter.reportgenerator.graph.timeVsThreads.title=Time VS Threads

# Bytes Throughput Over Time graph definition
jmeter.reportgenerator.graph.bytesThroughputOverTime.classname=org.apache.jmeter.report.processor.graph.impl.BytesThroughputGraphConsumer
jmeter.reportgenerator.graph.bytesThroughputOverTime.title=Bytes Throughput Over Time
jmeter.reportgenerator.graph.bytesThroughputOverTime.property.set_granularity=${jmeter.reportgenerator.overall_granularity}

# Response Time Over Time graph definition
jmeter.reportgenerator.graph.responseTimesOverTime.classname=org.apache.jmeter.report.processor.graph.impl.ResponseTimeOverTimeGraphConsumer
jmeter.reportgenerator.graph.responseTimesOverTime.title=Response Time Over Time
jmeter.reportgenerator.graph.responseTimesOverTime.property.set_granularity=${jmeter.reportgenerator.overall_granularity}

# Latencies Over Time graph definition
jmeter.reportgenerator.graph.latenciesOverTime.classname=org.apache.jmeter.report.processor.graph.impl.LatencyOverTimeGraphConsumer
jmeter.reportgenerator.graph.latenciesOverTime.title=Latencies Over Time
jmeter.reportgenerator.graph.latenciesOverTime.property.set_granularity=${jmeter.reportgenerator.overall_granularity}

# Response Time Vs Request graph definition
jmeter.reportgenerator.graph.responseTimeVsRequest.classname=org.apache.jmeter.report.processor.graph.impl.ResponseTimeVSRequestGraphConsumer
jmeter.reportgenerator.graph.responseTimeVsRequest.title=Response Time Vs Request
jmeter.reportgenerator.graph.responseTimeVsRequest.exclude_controllers=true
jmeter.reportgenerator.graph.responseTimeVsRequest.property.set_granularity=${jmeter.reportgenerator.overall_granularity}

# Latencies Vs Request graph definition
jmeter.reportgenerator.graph.latencyVsRequest.classname=org.apache.jmeter.report.processor.graph.impl.LatencyVSRequestGraphConsumer
jmeter.reportgenerator.graph.latencyVsRequest.title=Latencies Vs Request
jmeter.reportgenerator.graph.latencyVsRequest.exclude_controllers=true
jmeter.reportgenerator.graph.latencyVsRequest.property.set_granularity=${jmeter.reportgenerator.overall_granularity}

# Hits Per Second graph definition
jmeter.reportgenerator.graph.hitsPerSecond.classname=org.apache.jmeter.report.processor.graph.impl.HitsPerSecondGraphConsumer
jmeter.reportgenerator.graph.hitsPerSecond.title=Hits Per Second
jmeter.reportgenerator.graph.hitsPerSecond.exclude_controllers=true
jmeter.reportgenerator.graph.hitsPerSecond.property.set_granularity=${jmeter.reportgenerator.overall_granularity}

# Codes Per Second graph definition
jmeter.reportgenerator.graph.codesPerSecond.classname=org.apache.jmeter.report.processor.graph.impl.CodesPerSecondGraphConsumer
jmeter.reportgenerator.graph.codesPerSecond.title=Codes Per Second
jmeter.reportgenerator.graph.codesPerSecond.exclude_controllers=true
jmeter.reportgenerator.graph.codesPerSecond.property.set_granularity=${jmeter.reportgenerator.overall_granularity}

# Transactions Per Second graph definition
jmeter.reportgenerator.graph.transactionsPerSecond.classname=org.apache.jmeter.report.processor.graph.impl.TransactionsPerSecondGraphConsumer
jmeter.reportgenerator.graph.transactionsPerSecond.title=Transactions Per Second
jmeter.reportgenerator.graph.transactionsPerSecond.property.set_granularity=${jmeter.reportgenerator.overall_granularity}

# HTML Export
jmeter.reportgenerator.exporter.html.classname=org.apache.jmeter.report.dashboard.HtmlTemplateExporter

# Sets the destination directory for generated html pages.
# This will be overridden by the command line option -o
jmeter.reportgenerator.exporter.html.property.output_dir=/tmp/test-report

#------------------------------------------------------
#SAVE SERVICE Configurations
#---------------------------------------------------------
jmeter.save.saveservice.bytes = true
jmeter.save.saveservice.label = true
jmeter.save.saveservice.latency = true
jmeter.save.saveservice.response_code = true
jmeter.save.saveservice.response_message = true
jmeter.save.saveservice.successful = true
jmeter.save.saveservice.thread_counts = true
jmeter.save.saveservice.thread_name = true
jmeter.save.saveservice.time = true
jmeter.save.saveservice.print_field_names=true
# the timestamp format must include the time and should include the date.
# For example the default, which is milliseconds since the epoch:
#jmeter.save.saveservice.timestamp_format = ms
# Or the following would also be suitable
jmeter.save.saveservice.timestamp_format = dd/MM/yyyy HH:mm
#save service assertion
jmeter.save.saveservice.assertion_results_failure_message = true

Test Results - CSV file:

Before Generating the script ,run your Test Plan as specified time interval and once all threads are completed then simple data Writer generates Test Results file as specified location as below screenshot.Now run Test plan up-to 300 seconds i.e 5 Minutes,results file will generate from Simple Data Writer ,here i am saving test result file in CSV file.

Jmeter Report Dashboard


Now open Command Prompt.


How to Generate Jmeter Report Dashboard

Go to ApacheJmeter3.0/bin path as below
Enter below command to generate the reports as per test results csv file.

jmeter -g E:\JMETER_Tutorials\Software-Testing.csv -o E:\JMETER_Tutorials\HTMLReports
How to Generate Jmeter Report Dashboard
How to Generate JMeter Report Dashboard


Press Enter ,it will display in case any errors present in generated CSV file other wise it will generate Apache Jmeter Report Dashboard in specified folder.

How to Generate Jmeter Report Dashboard

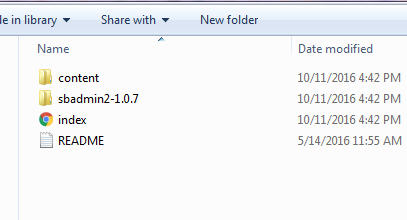
Go to HTMLReports folder and it will display below folders and index.html file
  1. Content
  2. sbadmin2-1.0.7
  3. index.html
  4. README


Now open index.html in chrome browser and it will display Apache Report Dashboard as below.

How to Generate Jmeter Report Dashboard

How to Generate Jmeter Report Dashboard

How to Generate Jmeter Report Dashboard

How to Generate Jmeter Report Dashboard

Please provide your valuable comments and suggestions on this post.

How to run a test plan for a specified period of time

How to run a test plan for a specified period of time in Apache Jmeter,in my previous post you learned Proxy set up,record script in Jmeter for web applications,now in this post you will learn how to run a test plan for a specified period of time in Apache Jmeter.

Before you read this post,please read below posts


Please follow below steps to run your Test plan for a specific amount of time in Jmeter.

Step 1 : Add Thread Group to Test Plan,in Thread group mention specified Thread Users,Ramp-Up Period,Loop Count.

How to run a test plan for a specified period of time

Step 2 : Add HTTP Request Default to provide Server Name/Ip and Port number to perform on specific applications.
Step 3 : Add or Record HTTP Samples for AUT.

How to run a test plan for a specified period of time_1

Step 4 : Now add Summary Report/View Result Tree from  Listeners.
Step 5: Now go to Thread Group Select Scheduler check box ,it will enable Schedule Configuration fields to enter the details,which will have below fields.

Duration(Seconds)
Start Up Delay(Seconds)
Start Time 2016/10/10 22:39:23
End Time 2016/10/10 22:39:23

Start and End time is default no need of changing anything ,just you need to change Duration (Seconds) field as below.

How to run a test plan for a specified period of time_2


In case you want to run a test plan for 5 minutes then in Seconds 1 minute = 60 sec,so 5 minutes = 300 seconds.Simple enter 300 in Duration field,Save the script as .jmx extension.
Now run the Test Plan it will run up to 5 minutes and reports will generate as below.

Note : Select LoopCount as Forever check box.

Summary Report

Summary Report will show you the details as below

Summary Report at 1 minute 16 seconds

How to run a test plan for a specified period of time_3


Summary Report at 4 minutes 6 seconds.


How to run a test plan for a specified period of time_4


Summary Report at 5 Minutes means 300 Seconds as below.


How to run a test plan for a specified period of time_5


Here all threads are stopped ,please see below screenshot.


How to run a test plan for a specified period of time_6


Like this you can run your Test plan up to specified period of time in Jmeter.

Apache JMeter proxy setup step by step


Welcome to Apache JMeter Proxy set up step by step ,in this post I'm going to show you how exactly you need to set up proxy in Jmeter with step by step.Here I am using Firefox browser to set up proxy under network settings.

Why Proxy set up?

Proxy which is limited works in companies because in order to save from virus which is coming through different software.Coming to JMeter proxy set up which is requires while Recording the script for web application in different browser,please read Record Script in Jmeter in this post.

If you want to record the script in Apache Jmeter it is very important to set up Proxy settings under network settings of browsers then only JMeter recognize your actions on applications and record the same in Recording Controller where it will generate HTTP Request samples under Thread Groups.

Step By Step Proxy Set Up

1.Open Apache Jmeter from apache-jmeter-3.0\bin folder i.e for Windows double click on jmeter.bat file.
Apache JMeter proxy setup step by step
Open APACHE JMeter

2.Now add Thread Group to Test Plan.
3.Add HTTP Request Defaults.
4.Add Recording Controller.
5.Add HTTP Test Script Recorder under Workbench.
6.Under HTTP Test Script Recorder simply click on Start button ,it will ask you to install RooTCACertificate which will generates in bin folder of Jmeter.

Apache JMeter proxy setup step by step

7.Click on Ok button once you install CACertificate.
8.Now open Firefox browser.
9.Go to Tools - Options from Menu bar.

Apache JMeter proxy setup step by step
Open Firefox Browser

10.Click on Advance tab.

Apache JMeter proxy setup step by step

11.Click on Network tab and click on Settings button.
12.It will open Connection Settings window.
Apache JMeter proxy setup step by step
Connection Settings

13.In this window simply Click on Manual Proxy Configurations
14.Enter HTTP Proxy as Localhost and  Port number is 8181 as described in Record Script in Jmeter post,Please read this post to understand the main concept on Port number declaration.
15.Click on Use Proxy Server for all protocols check box.
16.Click on OK button,that's it you are done,now JMeter will record the script what ever actions you will perform on browser.

What have you learned?

How to open JMeter in windows.
Set up Proxy settings in Firefox Browser.
How to record the script in Jmeter.