Apache JMeter is an open source performance tool which is helpful in testing load test for WebApplications and WebServices,REST API services.In latest JMeter 3.0 version apache software included Generate Jmeter Report Dashboard using APDEX(Application Performance Index).
 |
| How to Generate JMeter Report Dashboard |
What is APDEX?
APDEX is an open standard which is developed by an alliance companies.APDEX which is useful in measure user satisfaction with the help of response time of applications and Services(WebServices/REST API).APDEX measures average time with the help of response time of application under test whether it could be web applications or WebServices.APDEX measure application response time with three levels,those are
1.Satisfied.
2.Toleration Threshold.
3.Frustration Threshold.
How to Generate JMeter Report Dashboard
Please follow below steps to Generate JMeter report dashboards for a test plan.- Download Apache JMeter 3.0 from Apache Software Foundation website.
- Unzip the file.
- Open Jmeter GUI using jmeter.bat file from Apache Jmeter3.0/bin folder.
- Create Test plan for Web Applications or Web-Services.
- Add Summary Report,Simple Data Writer from Listeners.
Set Thread Group as
- Number of Thread(Users) - 5
- Ramp Up Period - 2
- Loop Count Foreve
- Duration in Scheduler - 300
- StartUp Delay - 0
Please Read below posts to understand current post easily.
Record Script in Jmeter
Run test plan untill specified Time.
Note:
Please don't create any CSV file file before running your Test Plan ,with the help of Simple Data Writer Test Result file automatically created in specified location.
Simple Data Writer Configuration:
Before Running your test plan we should configure below fields in Simple Data Writer window panel,those are
- timeStamp
- elapsed
- label
- responseCode
- responseMessage
- threadName
- dataType
- success
- failureMessage
- bytes
- grpThreads
- allThreads
- Latency
- IdleTime
Just click on Configure button in Simple Data Writer window panel then it will open Simple Result Save Configuration window then you have to select above checkboxes ,please see below screenshot.
Once everything is done just click on Done button and save your Test Plan script.
View Below Video for Better Understand
Jmeter Report Generation Configuration
In Apache jmeter 3.0 version it has given reportgeneration properties file ,if you open that file it will display all report generation configuration details,simply copy those jmeter.reportgenerator configuration in User Properties file as below.Copy SAVE Service configurations also in User Properties file.
#---------------------------------------------------------------------------
# Reporting configuration
#---------------------------------------------------------------------------
# Sets the satisfaction threshold for the APDEX calculation (in milliseconds).
jmeter.reportgenerator.apdex_satisfied_threshold=500
# Sets the tolerance threshold for the APDEX calculation (in milliseconds).
jmeter.reportgenerator.apdex_tolerated_threshold=1500
# Sets the size of the sliding window used by percentile evaluation.
# Caution : higher value provides a better accuracy but needs more memory.
#jmeter.reportgenerator.statistic_window = 200000
# Configure this property to change the report title
jmeter.reportgenerator.report_title=Apache JMeter Dashboard
# Defines the overall granularity for over time graphs
jmeter.reportgenerator.overall_granularity=60000
# Response Time Percentiles graph definition
jmeter.reportgenerator.graph.responseTimePercentiles.classname=org.apache.jmeter.report.processor.graph.impl.ResponseTimePercentilesGraphConsumer
jmeter.reportgenerator.graph.responseTimePercentiles.title=Response Time Percentiles
# Response Time Distribution graph definition
jmeter.reportgenerator.graph.responseTimeDistribution.classname=org.apache.jmeter.report.processor.graph.impl.ResponseTimeDistributionGraphConsumer
jmeter.reportgenerator.graph.responseTimeDistribution.title=Response Time Distribution
jmeter.reportgenerator.graph.responseTimeDistribution.property.set_granularity=500
# Active Threads Over Time graph definition
jmeter.reportgenerator.graph.activeThreadsOverTime.classname=org.apache.jmeter.report.processor.graph.impl.ActiveThreadsGraphConsumer
jmeter.reportgenerator.graph.activeThreadsOverTime.title=Active Threads Over Time
jmeter.reportgenerator.graph.activeThreadsOverTime.property.set_granularity=${jmeter.reportgenerator.overall_granularity}
# Time VS Threads graph definition
jmeter.reportgenerator.graph.timeVsThreads.classname=org.apache.jmeter.report.processor.graph.impl.TimeVSThreadGraphConsumer
jmeter.reportgenerator.graph.timeVsThreads.title=Time VS Threads
# Bytes Throughput Over Time graph definition
jmeter.reportgenerator.graph.bytesThroughputOverTime.classname=org.apache.jmeter.report.processor.graph.impl.BytesThroughputGraphConsumer
jmeter.reportgenerator.graph.bytesThroughputOverTime.title=Bytes Throughput Over Time
jmeter.reportgenerator.graph.bytesThroughputOverTime.property.set_granularity=${jmeter.reportgenerator.overall_granularity}
# Response Time Over Time graph definition
jmeter.reportgenerator.graph.responseTimesOverTime.classname=org.apache.jmeter.report.processor.graph.impl.ResponseTimeOverTimeGraphConsumer
jmeter.reportgenerator.graph.responseTimesOverTime.title=Response Time Over Time
jmeter.reportgenerator.graph.responseTimesOverTime.property.set_granularity=${jmeter.reportgenerator.overall_granularity}
# Latencies Over Time graph definition
jmeter.reportgenerator.graph.latenciesOverTime.classname=org.apache.jmeter.report.processor.graph.impl.LatencyOverTimeGraphConsumer
jmeter.reportgenerator.graph.latenciesOverTime.title=Latencies Over Time
jmeter.reportgenerator.graph.latenciesOverTime.property.set_granularity=${jmeter.reportgenerator.overall_granularity}
# Response Time Vs Request graph definition
jmeter.reportgenerator.graph.responseTimeVsRequest.classname=org.apache.jmeter.report.processor.graph.impl.ResponseTimeVSRequestGraphConsumer
jmeter.reportgenerator.graph.responseTimeVsRequest.title=Response Time Vs Request
jmeter.reportgenerator.graph.responseTimeVsRequest.exclude_controllers=true
jmeter.reportgenerator.graph.responseTimeVsRequest.property.set_granularity=${jmeter.reportgenerator.overall_granularity}
# Latencies Vs Request graph definition
jmeter.reportgenerator.graph.latencyVsRequest.classname=org.apache.jmeter.report.processor.graph.impl.LatencyVSRequestGraphConsumer
jmeter.reportgenerator.graph.latencyVsRequest.title=Latencies Vs Request
jmeter.reportgenerator.graph.latencyVsRequest.exclude_controllers=true
jmeter.reportgenerator.graph.latencyVsRequest.property.set_granularity=${jmeter.reportgenerator.overall_granularity}
# Hits Per Second graph definition
jmeter.reportgenerator.graph.hitsPerSecond.classname=org.apache.jmeter.report.processor.graph.impl.HitsPerSecondGraphConsumer
jmeter.reportgenerator.graph.hitsPerSecond.title=Hits Per Second
jmeter.reportgenerator.graph.hitsPerSecond.exclude_controllers=true
jmeter.reportgenerator.graph.hitsPerSecond.property.set_granularity=${jmeter.reportgenerator.overall_granularity}
# Codes Per Second graph definition
jmeter.reportgenerator.graph.codesPerSecond.classname=org.apache.jmeter.report.processor.graph.impl.CodesPerSecondGraphConsumer
jmeter.reportgenerator.graph.codesPerSecond.title=Codes Per Second
jmeter.reportgenerator.graph.codesPerSecond.exclude_controllers=true
jmeter.reportgenerator.graph.codesPerSecond.property.set_granularity=${jmeter.reportgenerator.overall_granularity}
# Transactions Per Second graph definition
jmeter.reportgenerator.graph.transactionsPerSecond.classname=org.apache.jmeter.report.processor.graph.impl.TransactionsPerSecondGraphConsumer
jmeter.reportgenerator.graph.transactionsPerSecond.title=Transactions Per Second
jmeter.reportgenerator.graph.transactionsPerSecond.property.set_granularity=${jmeter.reportgenerator.overall_granularity}
# HTML Export
jmeter.reportgenerator.exporter.html.classname=org.apache.jmeter.report.dashboard.HtmlTemplateExporter
# Sets the destination directory for generated html pages.
# This will be overridden by the command line option -o
jmeter.reportgenerator.exporter.html.property.output_dir=/tmp/test-report
#------------------------------------------------------
#SAVE SERVICE Configurations
#---------------------------------------------------------
jmeter.save.saveservice.bytes = true
jmeter.save.saveservice.label = true
jmeter.save.saveservice.latency = true
jmeter.save.saveservice.response_code = true
jmeter.save.saveservice.response_message = true
jmeter.save.saveservice.successful = true
jmeter.save.saveservice.thread_counts = true
jmeter.save.saveservice.thread_name = true
jmeter.save.saveservice.time = true
jmeter.save.saveservice.print_field_names=true
# the timestamp format must include the time and should include the date.
# For example the default, which is milliseconds since the epoch:
#jmeter.save.saveservice.timestamp_format = ms
# Or the following would also be suitable
jmeter.save.saveservice.timestamp_format = dd/MM/yyyy HH:mm
#save service assertion
jmeter.save.saveservice.assertion_results_failure_message = true
Test Results - CSV file:
Before Generating the script ,run your Test Plan as specified time interval and once all threads are completed then simple data Writer generates Test Results file as specified location as below screenshot.Now run Test plan up-to 300 seconds i.e 5 Minutes,results file will generate from Simple Data Writer ,here i am saving test result file in CSV file.
Now open Command Prompt.
Go to ApacheJmeter3.0/bin path as below
Enter below command to generate the reports as per test results csv file.
jmeter -g E:\JMETER_Tutorials\Software-Testing.csv -o E:\JMETER_Tutorials\HTMLReports
 |
| How to Generate JMeter Report Dashboard |
Press Enter ,it will display in case any errors present in generated CSV file other wise it will generate Apache Jmeter Report Dashboard in specified folder.
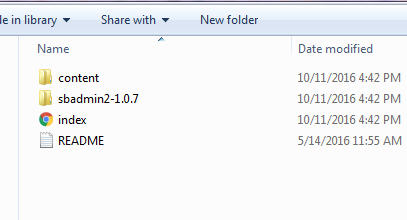
Go to HTMLReports folder and it will display below folders and index.html file
- Content
- sbadmin2-1.0.7
- index.html
- README
Now open index.html in chrome browser and it will display Apache Report Dashboard as below.
Please provide your valuable comments and suggestions on this post.


